

- Home >
- Education Center >
- The ABC’s of Arc Welding >
- Transition Temperature for Toughness >
The ABC’s of Arc Welding
Transition Temperature for Toughness
The resistance of steels and weld metals to brittle fractures can be evaluated by means of several fracture toughness tests. In particular, Charpy impact testing with V-notch specimens is often used to confirm compliance with a code or specification that includes impact test requirements, or when monitoring toughness with a quality control program.
The Charpy impact energy absorption of mild steel and low alloy steel weld is profoundly influenced by temperature, and therefore the specification includes the temperature at which a particular absorbed energy is required. For instance, if a steel weld for an offshore structure is likely to be exposed to temperatures as low as –40°C, the specification may require a minimum 47J at that temperature.
By contrast, transition temperature requires impact tests at temperatures that range from relatively high levels, at which the steel weld exhibits its highest toughness, down to low temperatures, at which the steel weld depicts its lowest toughness. When absorbed energy is plotted against temperature, mild steel and low alloy steel welds undergo a precipitous drop in energy over a relatively narrow mid-range span of temperature in the energy absorption transition curve shown in Figure 1. Of the various methods for defining energy absorption transition, the one most often used is to compute the mean energy absorption (TrE) between the upper shelf and lower shelf.
This drop in energy absorption starts when some cleavage occurs during fracture, which usually can be confirmed by the appearance of some brittle fracture surfaces on the broken specimen. The relative proportions of brittle fracture to ductile fracture observed on the broken surfaces (Figure 2) tested over the range of temperatures exhibit another transition curve as shown in Figure 1. The temperature at which a tested specimen will display half-brittle and half-ductile fracture texture denotes the fracture appearance transition temperature (FATT).
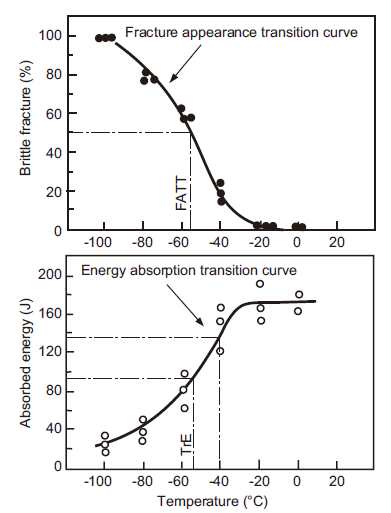
Figure 1: Energy absorption transition and fracture appearance transition curves of mild steel or low alloy steel welds.
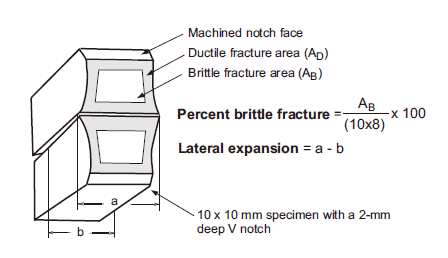
Figure 2: Schematic fracture appearance of a Charpy impact test specimen after breakage and definition of percent brittle fracture and lateral expansion.
The energy transition curve (Figure 1) exhibits about 134J at –40°C — above the aforementioned example of acceptance criteria (47J at –40°C) — and TrE and FATT are about –55°C. Obviously this steel weld would be judged to have an acceptable absorbed energy to the acceptance criteria.
The extent of lateral expansion (a-b in Figure 2) is also considered an acceptable means of quantitative toughness evaluation. Lateral expansion measurements obtained in testing over a range of temperatures can develop a transition temperature similarly to TrE and FATT.
Introduction of welding consumables for offshore structures
KOBELCO welding consumables for low temperature steel (English only)
Education Center